

Inside the Website Analytics Admin Dashboard
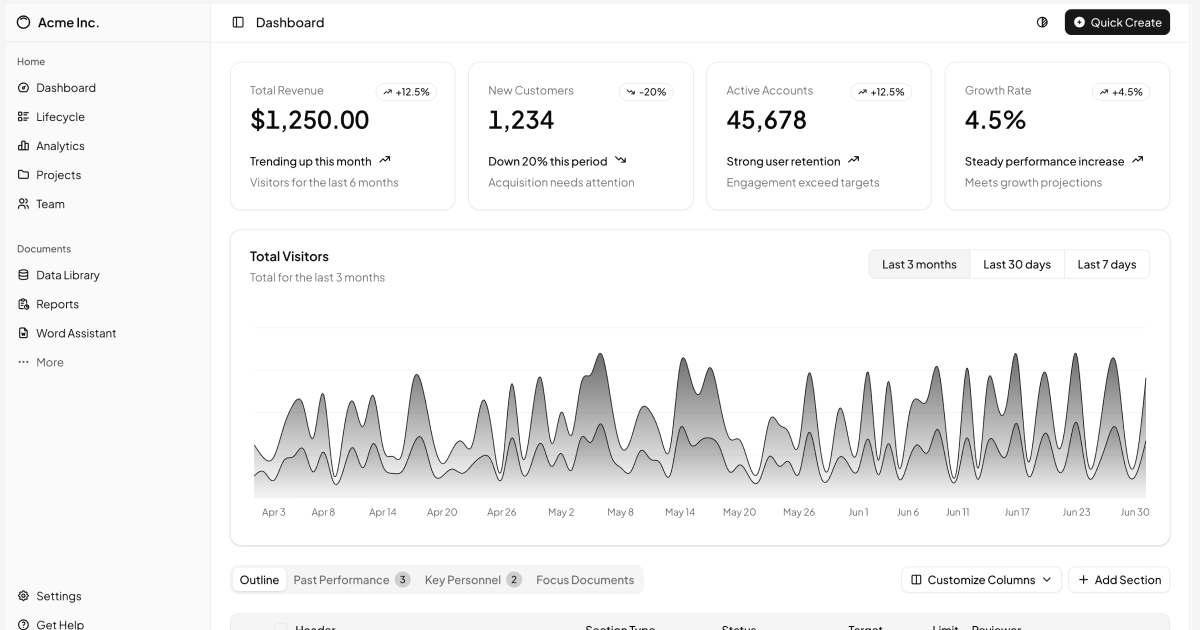
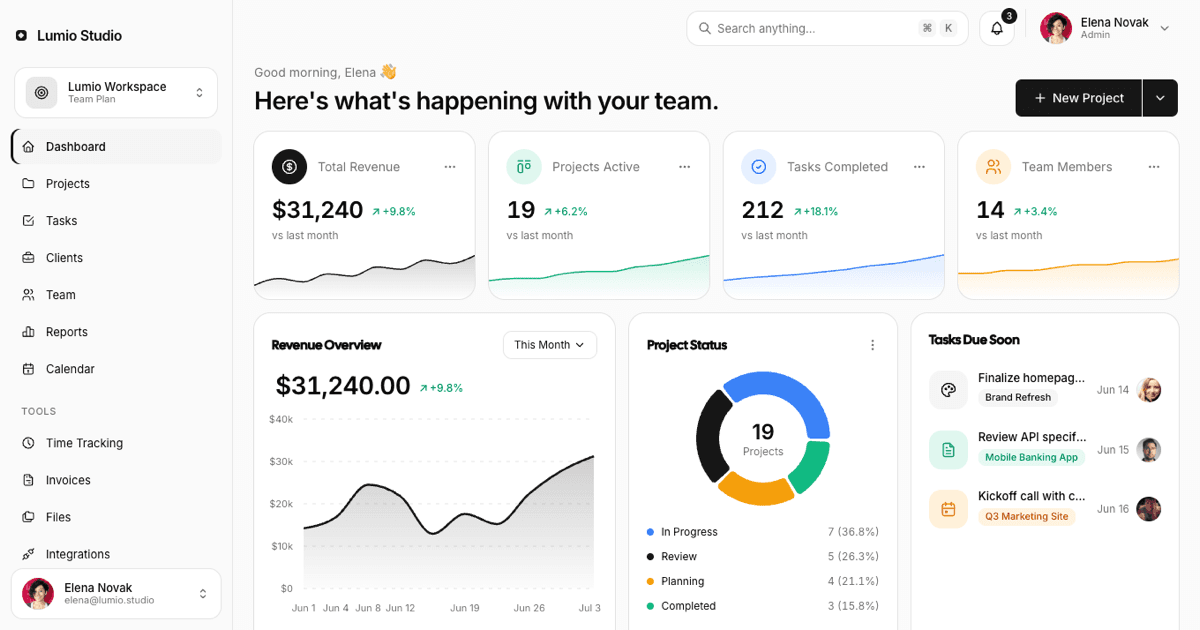
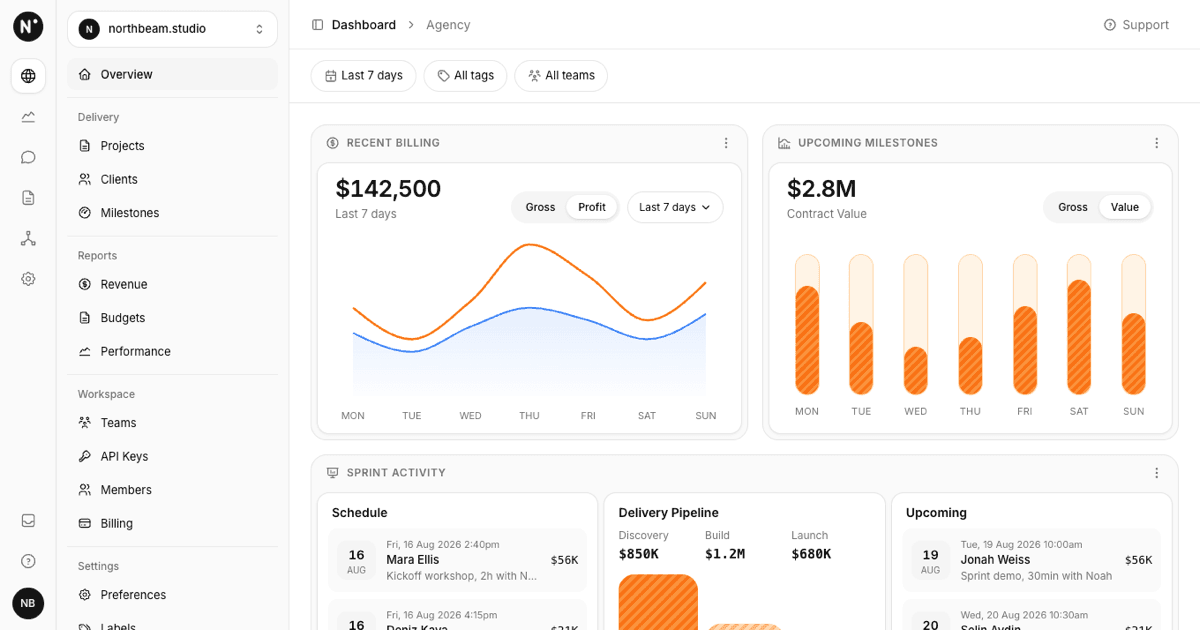
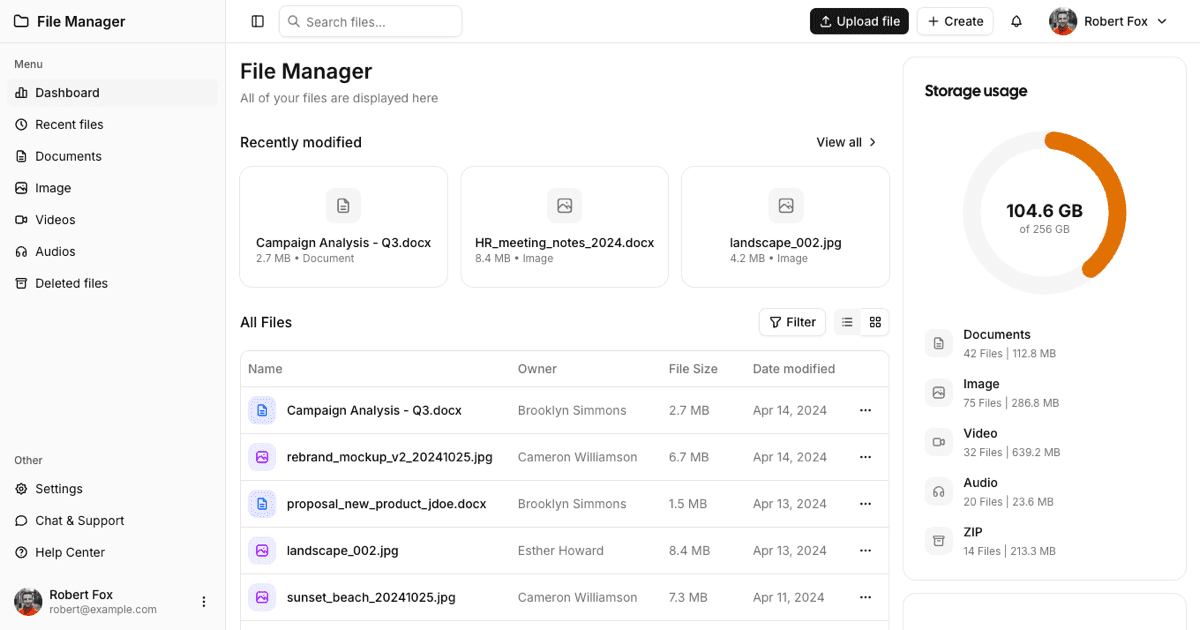
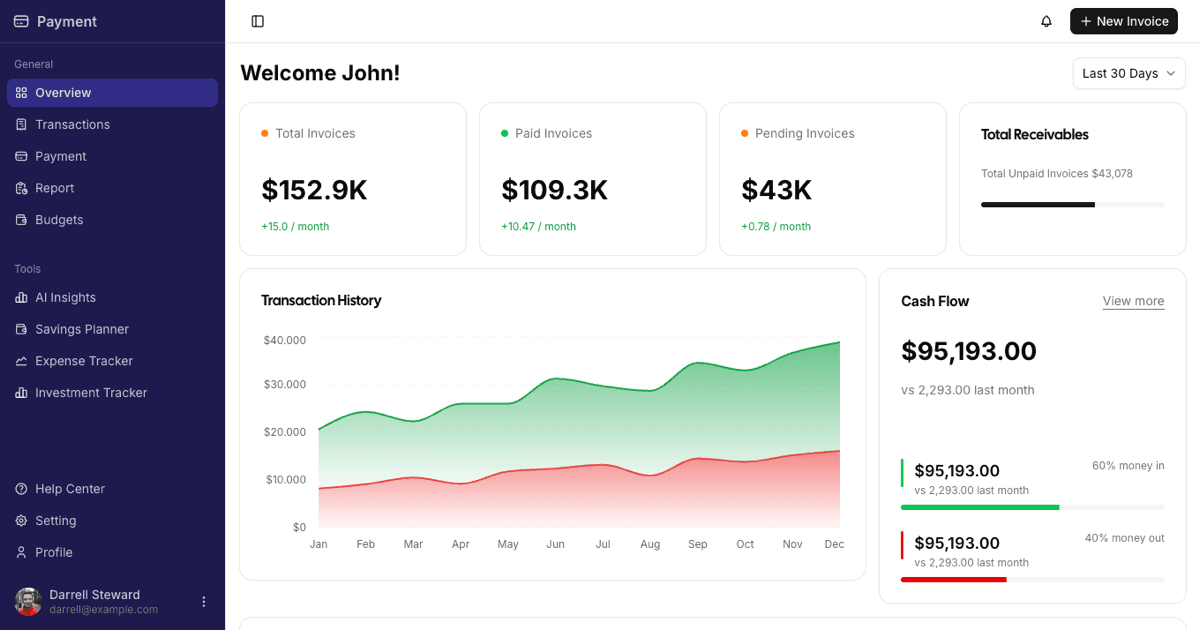
The Website Analytics Admin Dashboard is a full-page Shadcn UI block that recreates the classic traffic overview screen: a collapsible sidebar, a sticky header, a row of KPI cards, an interactive visitors chart, and a rich data table. Everything is wired together with the SidebarProvider layout from Shadcn UI, so the sidebar, header height, and content area share CSS variables such as --sidebar-width and --header-height.
It is the free entry point of the admin dashboards collection, which makes it a practical starting skeleton for any product that needs to report page views, sessions, or growth numbers. Marketing sites, SaaS admin panels, and internal reporting tools can all reuse the same shell and swap the metrics.
The Interactive Traffic Chart and KPI Cards
The chart-area-interactive component renders a stacked area chart of desktop and mobile visitors with Recharts, wrapped in the ChartContainer, ChartTooltip, and ChartTooltipContent primitives so tooltip colors follow your theme automatically. A ToggleGroup switches between 90, 30, and 7 day ranges on desktop, while a Select takes over on small screens through the useIsMobile hook.
Above the chart, SectionCards lays out four KPI cards for revenue, new customers, active accounts, and growth rate. The grid uses Tailwind container queries (@container and @5xl/main variants), so the cards respond to the width of the content column rather than the viewport, which keeps the block usable inside iframes and split layouts.
A Drag-Enabled Visitors Table
The data table is the most involved component in this block. It combines TanStack Table for sorting, pagination, faceting, and column visibility with dnd-kit for vertical row reordering, using a grip handle cell and the restrictToVerticalAxis modifier.
Row data is validated with a zod schema, clicking a row title opens a Drawer with an embedded mini chart and an edit form, and actions fire sonner toasts. Checkbox selection, a column visibility dropdown, and full pagination controls round out a table you can lift straight into production admin screens.
Restyling Analytics With CSS Variables
The block ships with next-themes and its own theme toggle, so dark and light modes work out of the box. Every surface uses semantic tokens: bg-background for panels, text-muted-foreground for secondary labels, and chart-1 through chart-5 variables for the area fills.
To rebrand it, adjust the oklch values in globals.css instead of editing components. Because the chart series reference var(--color-desktop) style variables generated by ChartConfig, changing a single token recolors the KPI badges, gradients, and tooltips consistently in both themes. Tailwind utility classes handle the rest of the spacing and typography.
Free Code, CLI Install, and Framework Coverage
This dashboard is a free block, so the complete source sits in the code tab for anyone to read and copy without an account. If you prefer automation, the command bar at the top of the page gives you a ready shadcn CLI line with npm, pnpm, yarn, and bun variants that installs the page, its components, and the Sidebar component dependencies in one step.
React is only one of three implementations. The same analytics screen is also published for Vuejs on top of shadcn-vue and for Svelte on top of shadcn-svelte, so teams outside the React ecosystem get an equivalent set of components rather than a manual rewrite.